TYPE-0 PERFECT SEIHA
Server Info:
FreeBSD scimitar.blueboard.cz 13.5-STABLE FreeBSD 13.5-STABLE stable/13-4f2925105 GENERIC amd64
Software:
Apache
User:
www
Crot
Crot File
Crot Dir
Crot Command
[LockSelf]
[HOME]
data
www
19068
fszoo_net
www
api
1
root
vendor
tracy
tracy
Show Hidden Files
Edit File: /data/www/19068/fszoo_net/www/api/1/root/vendor/tracy/tracy/readme.md
[Tracy](https://tracy.nette.org) - PHP debugger ============================================== [](https://packagist.org/packages/tracy/tracy) [](https://travis-ci.org/nette/tracy) [](https://github.com/nette/tracy/releases) [](https://github.com/nette/tracy/blob/master/license.md) [](https://gitter.im/nette/tracy) Tracy library is a useful helper for everyday PHP programmers. It helps you to: - quickly detect and correct errors - log errors - dump variables - measure execution time of scripts/queries - see memory consumption PHP is a perfect language for making hardly detectable errors because it gives a great flexibility to programmers. Tracy\Debugger is more valuable because of that. It is a ultimate tool among the diagnostic ones. If you are meeting Tracy the first time, believe me, your life starts to be divided one before the Tracy and the one with her. Welcome to the good part! Installation and requirements ----------------------------- The best way how to install Tracy is to [download a latest package](https://github.com/nette/tracy/releases) or use a Composer: ``` php composer.phar require tracy/tracy ``` Tracy requires PHP version 5.3.0 or newer (master requires PHP 5.6). Usage ----- Activating Tracy is easy. Simply add these two lines of code, preferably just after library loading (using `require 'src/tracy.php'` or via Composer): ```php use Tracy\Debugger; Debugger::enable(); ``` The first thing you will notice on the website is a Debugger Bar. Debugger Bar ------------ The Debugger Bar is a floating panel. It is displayed in the bottom right corner of a page. You can move it using the mouse. It will remember its position after the page reloading. [](https://nette.github.io/tracy/tracy-debug-bar.html) You can add other useful panels into the Debugger Bar. You can find interesing ones in [Addons](https://addons.nette.org) or you can create your own. Visualization of errors and exceptions -------------------------------------- Surely, you know how PHP reports errors: there is something like this in the page source code: ```pre <b>Parse error</b>: syntax error, unexpected '}' in <b>HomepagePresenter.php</b> on line <b>15</b> ``` or uncaught exception: ```pre <b>Fatal error</b>: Uncaught Nette\MemberAccessException: Call to undefined method Nette\Application\UI\Form::addTest()? in /sandbox/vendor/nette/utils/src/Utils/ObjectMixin.php:100 Stack trace: #0 /sandbox/vendor/nette/utils/src/Utils/Object.php(75): Nette\Utils\ObjectMixin::call(Object(Nette\Application\UI\Form), 'addTest', Array) #1 /sandbox/app/forms/SignFormFactory.php(32): Nette\Object->__call('addTest', Array) #2 /sandbox/app/presenters/SignPresenter.php(21): App\Forms\SignFormFactory->create() #3 /sandbox/vendor/nette/component-model/src/ComponentModel/Container.php(181): App\Presenters\SignPresenter->createComponentSignInForm('signInForm') #4 /sandbox/vendor/nette/component-model/src/ComponentModel/Container.php(139): Nette\ComponentModel\Container->createComponent('signInForm') #5 /sandbox/temp/cache/latte/15206b353f351f6bfca2c36cc.php(17): Nette\ComponentModel\Co in <b>/sandbox/vendor/nette/utils/src/Utils/ObjectMixin.php</b> on line <b>100</b><br /> ``` It is not so easy to navigate through this output. If you enable Tracy, both errors and exceptions are displayed in a completely different form: [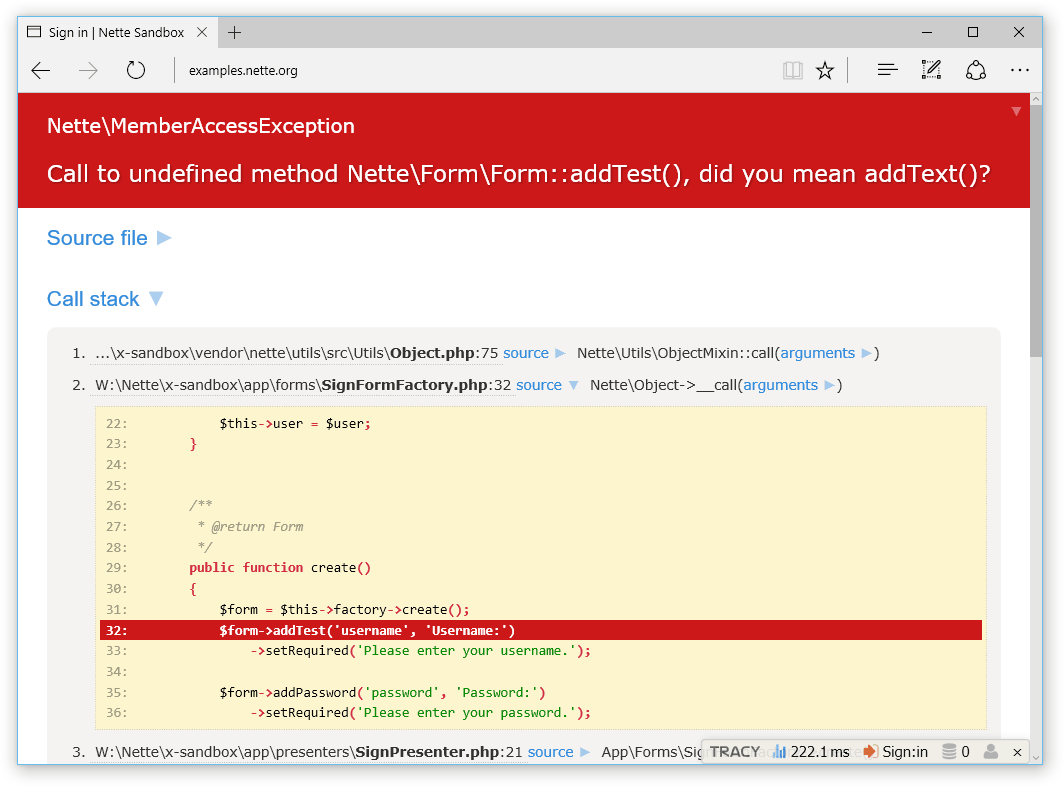](https://nette.github.io/tracy/tracy-exception.html) The error message literally screams. You can see a part of the source code with the highlighted line where the error occurred. A message clearly explains an error. The entire site is [interactive, try it](https://nette.github.io/tracy/tracy-exception.html). And you know what? Fatal errors are captured and displayed in the same way. No need to install any extension (click for live example): [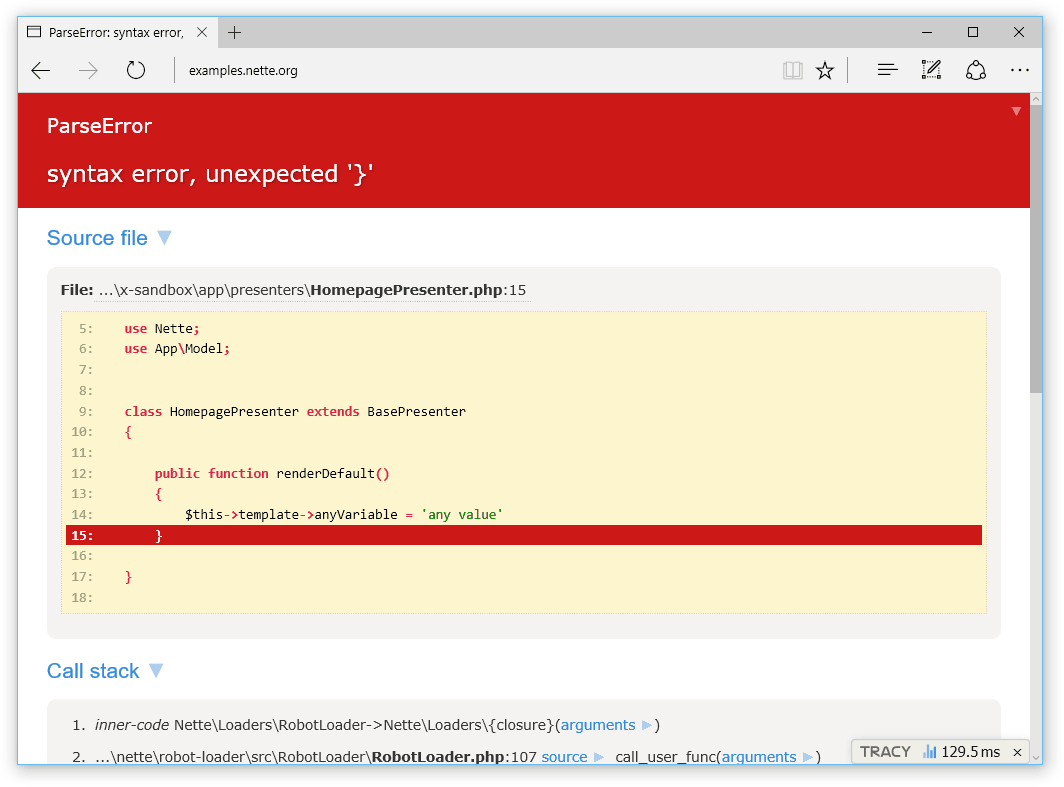](https://nette.github.io/tracy/tracy-error.html) Errors like a typo in a variable name or an attempt to open a nonexistent file generate reports of E_NOTICE or E_WARNING level. These can be easily overlooked and/or can be completely hidden in a web page graphic layout. Let Tracy manage them: [](https://nette.github.io/tracy/tracy-debug-bar.html) Or they may be displayed like errors: ```php Debugger::$strictMode = TRUE; ``` [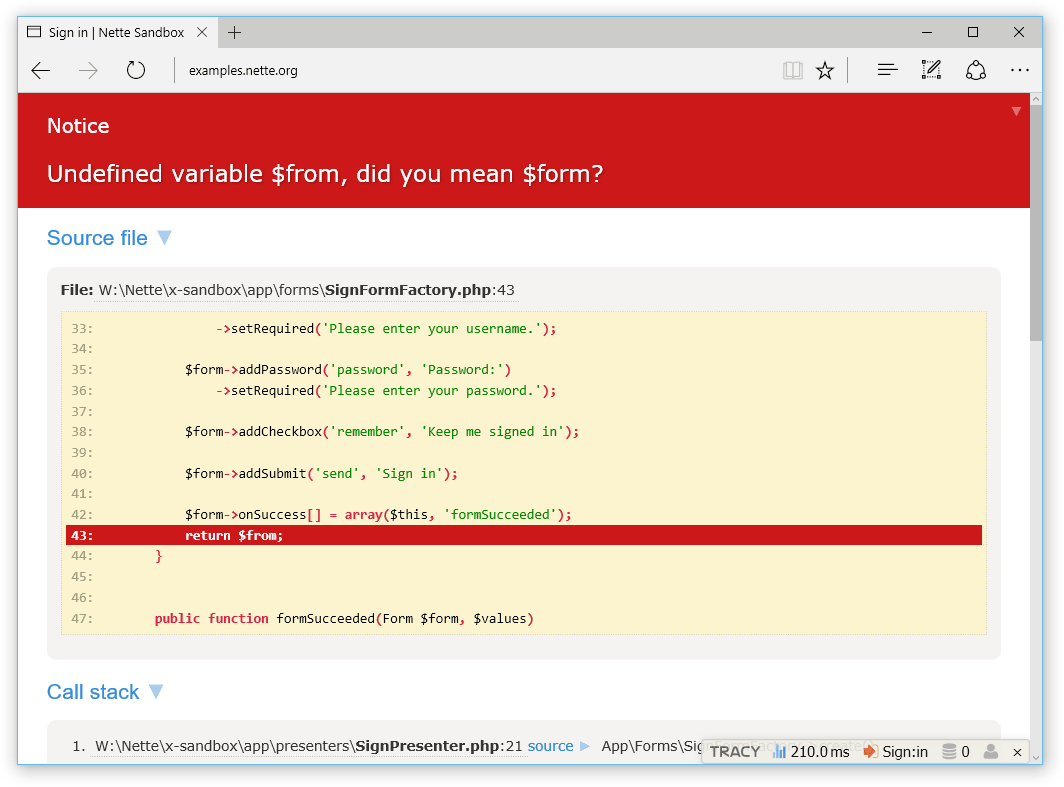](https://nette.github.io/tracy/tracy-notice.html) If your site uses Content Security Policy, you'll need to add `'unsafe-inline'` to `style-src`, and `'unsafe-inline'` & `'unsafe-eval'` to `script-src` for Tracy to work properly. Avoid adding these in production mode, if you can. Production mode and error logging --------------------------------- As you can see, Tracy is quite eloquent. It is appreciated in a development environment, but on a production server it would cause a disaster. Any debugging information cannot be listed there. Therefore Tracy has an environment autodetection and logging functionality. Instead of showing herself, Tracy stores information into a log file and shows the visitor a user-comprehensible server error message: [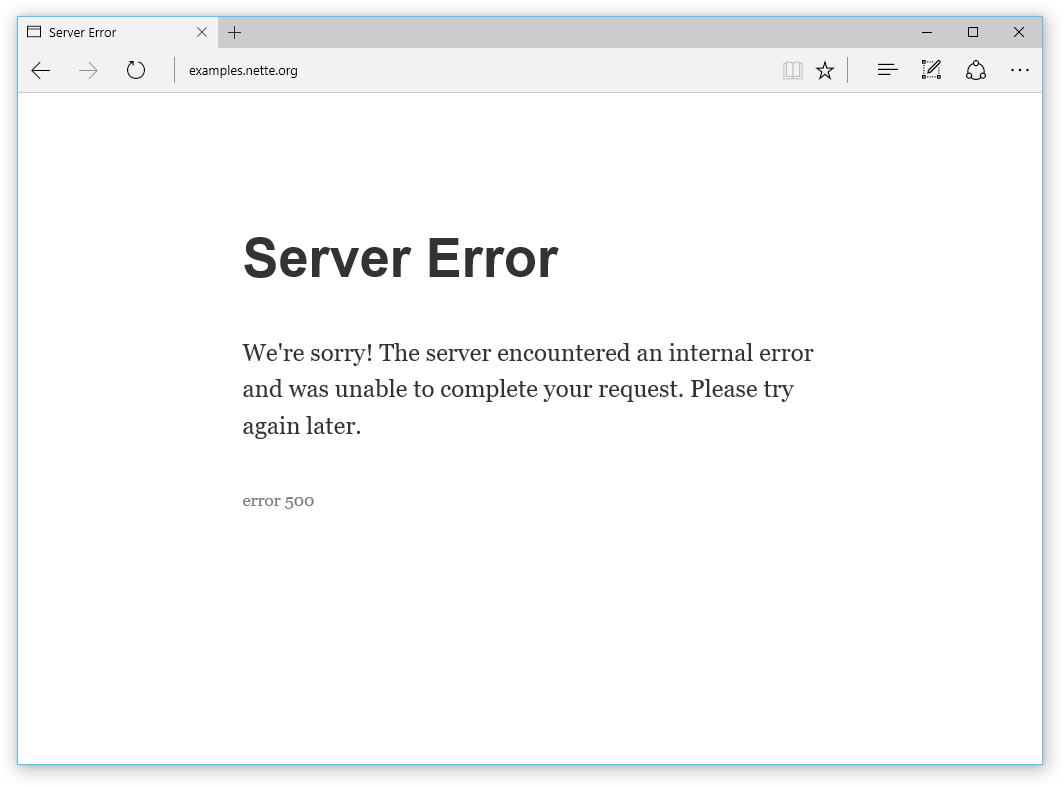](https://nette.github.io/tracy/tracy-production.html) Production output mode suppresses all debugging information which is sent out via `Debugger::dump()` or `Debugger::fireLog()`, and of course all error messages generated by PHP. So, even if you forget `Debugger::dump($obj)` in the source code, you do not have to worry about it on your production server. Nothing will be seen. The output mode is set by the first parameter of `Debugger::enable()`. You can specify either a constant `Debugger::PRODUCTION` or `Debugger::DEVELOPMENT`. If it is not specified, the default value `Debugger::DETECT` is used. In this case the system detects a server by IP address. The production mode is chosen if an application is accessed via public IP address. A local IP address leads to development mode. It is not necessary to set the mode in most cases. The mode is correctly recognized when you are launching the application on your local server or in production. In the production mode, Tracy automatically captures all errors and exceptions into a text log. Unless you specify otherwise, it will be stored in log/error.log. This error logging is extremely useful. Imagine, that all users of your application are actually betatesters. They are doing cutting-edge work for free when hunting bugs and you would be silly if you threw away their valuable reports to a recycle bin unnoticed. If you need to log your own messages or caught exceptions, use the method `log()`: ```php Debugger::log('Unexpected error'); // text message try { criticalOperation(); } catch (Exception $e) { Debugger::log($e); // log exception // or Debugger::log($e, Debugger::ERROR) // also sends an email notification } ``` A directory for errors logging can be set by the second parameter of the enable() method: ```php Debugger::enable(Debugger::DETECT, __DIR__ . '/mylog'); ``` If you want Tracy to log PHP errors like `E_NOTICE` or `E_WARNING` with detailed information (HTML report), set `Debugger::$logSeverity`: ```php Debugger::$logSeverity = E_NOTICE | E_WARNING; ``` For a real professional the error log is a crucial source of information and he or she wants to be notified about any new error immediately. Tracy helps him. She is capable of sending an email for every new error record. The variable $email identifies where to send these e-mails: ```php Debugger::$email = 'admin@example.com'; ``` To protect your e-mail box from flood, Tracy sends **only one message** and creates a file `email-sent`. When a developer receives the e-mail notification, he checks the log, corrects his application and deletes the `email-sent` monitoring file. This activates the e-mail sending again. Variable dumping ----------------- Every debugging developer is a good friend with the function `var_dump`, which lists all contents of any variable in detail. Unfortunately, its output is without HTML formatting and outputs the dump into a single line of HTML code, not to mention context escaping. It is necessary to replace the `var_dump` by a handier function. That is just what `Debugger::dump()` is. ```php $arr = array(10, 20.2, TRUE, NULL, 'hello'); dump($arr); // or Tracy\Debugger::dump($arr); ``` generates the output: 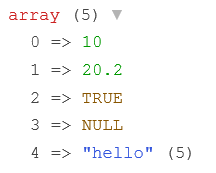 You can also change the nesting depth by `Debugger::$maxDepth` and displayed strings length by `Debugger::$maxLen`. Naturally, lower values accelerate Tracy rendering. ```php Debugger::$maxDepth = 2; // default: 3 Debugger::$maxLen = 50; // default: 150 ``` The `dump()` function can display other useful information. `Tracy\Dumper::LOCATION_SOURCE` adds tooltip with path to the file, where the function was called. `Tracy\Dumper::LOCATION_LINK` adds a link to the file. `Tracy\Dumper::LOCATION_CLASS` adds a tooltip to every dumped object containing path to the file, in which the object's class is defined. All these constants can be set in `Debugger::$showLocation` variable before calling the `dump()`. You can set multiple values at once using the `|` operator. ```php Debugger::$showLocation = Tracy\Dumper::LOCATION_SOURCE; // Shows path to where the dump() was called Debugger::$showLocation = Tracy\Dumper::LOCATION_CLASS | Tracy\Dumper::LOCATION_LINK; // Shows both paths to the classes and link to where the dump() was called Debugger::$showLocation = FALSE; // Hides additional location information Debugger::$showLocation = TRUE; // Shows all additional location information ``` Very handy alternative to `Debugger::dump()` is `Debugger::barDump()`. This allows us to dump variables in Debugger Bar. This is useful, because dumps don't mess up the output and we can also add a title to the dump. ```php Debugger::barDump([2, 4, 6, 8], 'even numbers up to ten'); Debugger::barDump([1, 3, 5, 7, 9], 'odd numbers up to ten'); ``` 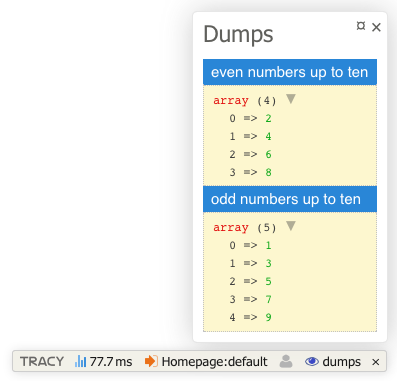 Timing ------ Another useful tool is the debugger stopwatch with a precision of microseconds: ```php Debugger::timer(); // sweet dreams my cherrie sleep(2); $elapsed = Debugger::timer(); // $elapsed = 2 ``` Multiple measurements at once can be achieved by an optional parameter. ```php Debugger::timer('page-generating'); // some code Debugger::timer('rss-generating'); // some code $rssElapsed = Debugger::timer('rss-generating'); $pageElapsed = Debugger::timer('page-generating'); ``` ```php Debugger::timer(); // runs the timer ... // some time consuming operation echo Debugger::timer(); // elapsed time in seconds ``` FireLogger ---------- You cannot always send debugging information to the browser window. This applies to AJAX requests, or generating XML files to output. In such cases, you can send the messages by a separate channel into FireLogger. Error, Notice and Warning levels are sent to FireLogger window automatically. It is also possible to log suppressed exceptions in running application when attention to them is important. How to do it? Firefox: - install extension [Firebug](http://getfirebug.com/) and [FireLogger](https://addons.mozilla.org/cs/firefox/addon/firelogger/) - turn on Firebug (using F12 key), enable tabs Net and Logger (stay on Logger) Chrome: - install extension [FireLogger for Chrome](https://chrome.google.com/webstore/detail/firelogger-for-chrome/hmagilfopmdjkeomnjpchokglfdfjfeh) - turn on Chrome DevTools (using Ctrl-Shift-I key) and open Console Navigate to [demo page](https://examples.nette.org/tracy/) and you will see messages sent from PHP. Because Tracy\Debugger communicates with FireLogger via HTTP headers, you must call the logging function before the PHP script sends anything to output. It is also possible to enable output buffering and delay the output. ```php use Tracy\Debugger; Debugger::fireLog('Hello World'); // send string into FireLogger console Debugger::fireLog($_SERVER); // or even arrays and objects Debugger::fireLog(new Exception('Test Exception')); // or exceptions ``` The result looks like this: 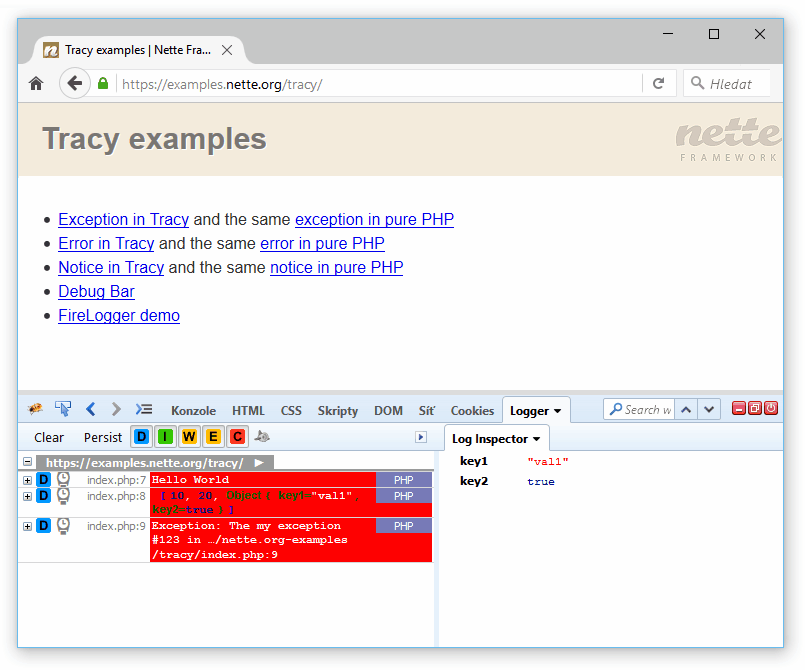
Crotin
Name
Size
Permissions
Modified
User/Group
examples
-
0755
2018-07-10 17:52:40
Unknown/Unknown
tools
-
0755
2016-01-11 22:51:37
Unknown/Unknown
composer.json
599
0644
2016-01-11 22:51:37
Unknown/Unknown
contributing.md
1233
0644
2016-01-11 22:51:48
Unknown/Unknown
license.md
2363
0644
2016-01-11 22:51:37
Unknown/Unknown
src
-
0755
2016-01-11 22:56:37
Unknown/Unknown
readme.md
12948
0644
2018-07-10 17:51:48
Unknown/Unknown
NGANU
Rename
Hapus
Chmod
Chown
Touch
Zip
Unzip
Download
Crotin